|
|
|
Getting the vibe of the atmosphere!
Listening to all the audible and inaudible activity of the atmosphere, or weather, via all our senses as well as augmented senses via sensors such as from Bendigo Tafe's Weather Station.
Listening to all the audible and inaudible activity of the atmosphere, or weather, via all our senses as well as augmented senses via sensors such as from Bendigo Tafe's Weather Station.
Sonification is the process of turning something inaudible, often data into sound for purposes of analysis including therecognition of patterns and aberrations in dynamic processes(such as weather). Sonification can also be of interest as musical starting point or inspiration. Composer and mathematician and Associate Professor of Music at Stony Brook University in New York, Margaret Schedel gives a great explanation of this subject, including some real world medical and science applications, here..
In two previous Sonification projects I have turned Algae related Ocean Temperature data into music and the patterns of raindrops on bitumen into pitched bell music phrases, both with animations as accompanying visual interpretations. ( a page with examples of these can be found here)
As part of the City of Gastronomy Creative Residency project I have taken data sets from the TAFE Weather Station for some sonification experiments. I have noticed a tension between focussing on ways to use sound as utilitarian function of revealing patterns or clarifying large masses of data or exploring sound design/music aesthetic interests- the two directions may only perhaps rarely occur concurrently ! However I can imagine a little app/device that can play you the sound of the current weather data with particular sound associations, set by the user and or manufacturer, that could quickly alert and or engage the listener to listening further to changes in weather conditions that may need attending to.An interesting investigation will also be to use the same midi data translated from weather data as parameters for animated visual representation again for analytical or aesthetic interests.
SONIFICATION OF WEATHER EXPERIMENTS -August 2022.
Approach 1.
MIDI(music note and timing) from Spreadsheet Data.
Using a new web based program, " Two Tone"
https://twotone.io/
TwoTone is a Sonify project built with support from Google News Initiative. The app was originally developed by Datavized Technologies.
What is it for?TwoTone is an introduction to data sonification and data-driven music.
Data sonification adds the option of listening to data to amplify understanding."
The Google app "TWO TONE" does make this process beautifully simple and accessible even just within a web browser. The web browser app can take formatted spreadsheets and render them as music parts for which you can select some inbuilt sound sources, basic rhythmic embellishments via repetitions and "arpeggios" and the ability to "filter" out high, low or medium pitches to create different layers for musical interest and or to highlight certain elements of the data, such as extremes of humidity/frost danger or whatever.
Approach 2.
Line Graphs from Spreadsheets used as "Sonograms" in Music Software.
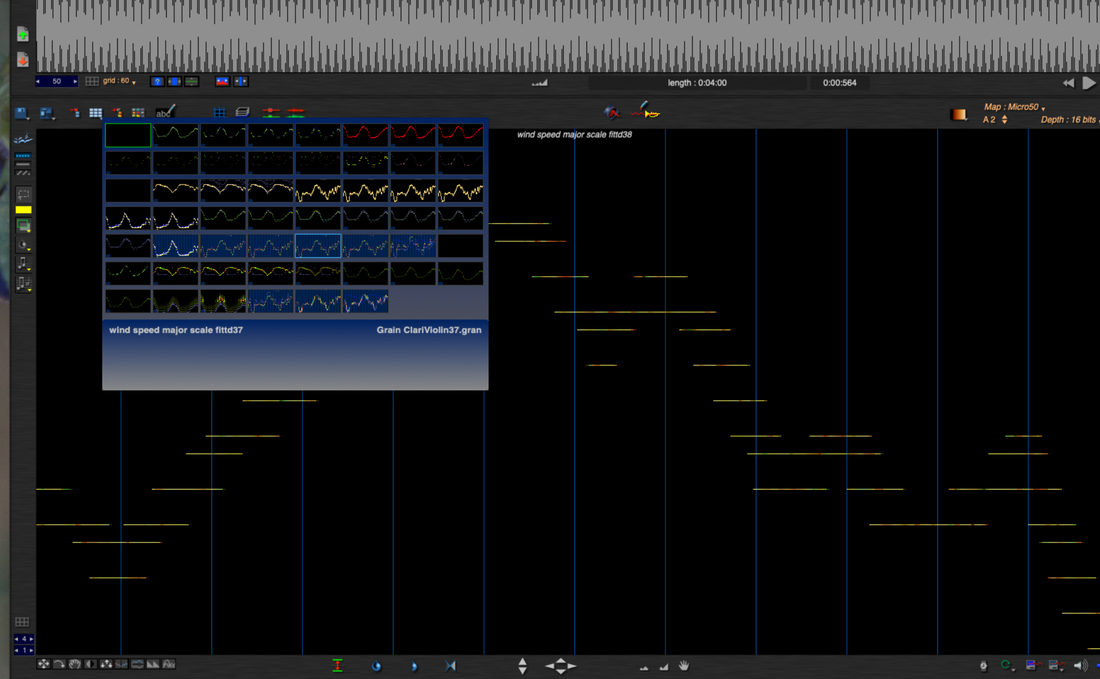
A second approach using preparing line graphs from spread sheets to use as Visual Sonograms in a software that converts pictures to sounds such as the very capable Metasynth sound program which may not be as quick and easy as the TwoTone midi process but does have alot more options that can be of use for finer detail of translation of data using microtonal pitch increments- instead of just 12 semitones for any data value you can literally have 100 's of tiny pitch increments "microtones" or custom scales to highlight or create particular musical interest.
Some examples below-
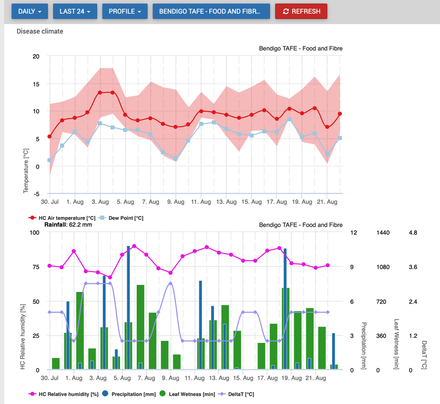
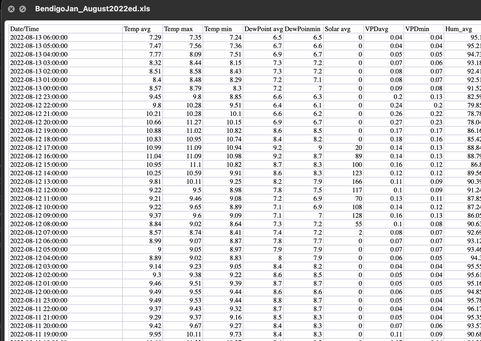
an example of the Weather Station Data:
the visual chart overview on the left and a prepared spreadsheet from the same site ready for translation into midi sound.
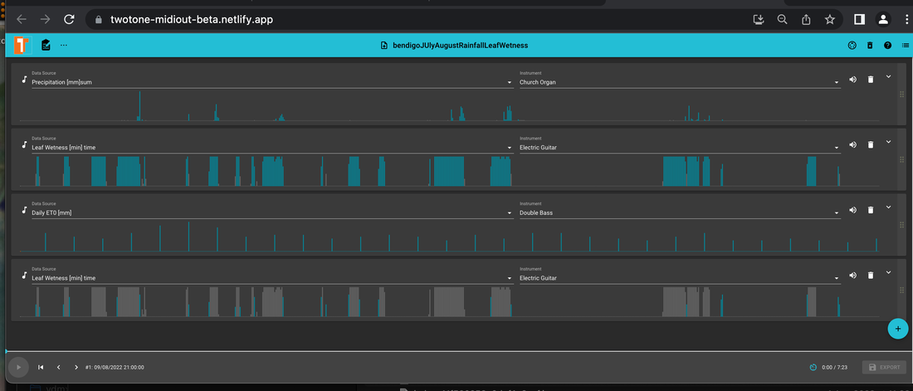
Four columns of weather data set to be played as instrument scores.
an example of the web browser sounds set to play weather data.
The same midi data used in a full midi studio set up with more variety in arrangement fading different data in and out , greater choice and shaping of sound sources, applying some more variation in rhythmic embellishment and so on.
A rendering of weather data as an ambient sonic atmosphere.
Using Line Graphs as Visual Sound Sources.
A more experimental microtonal rendition of weather data using Line Graphs as Sonograms in Metasyth music software .
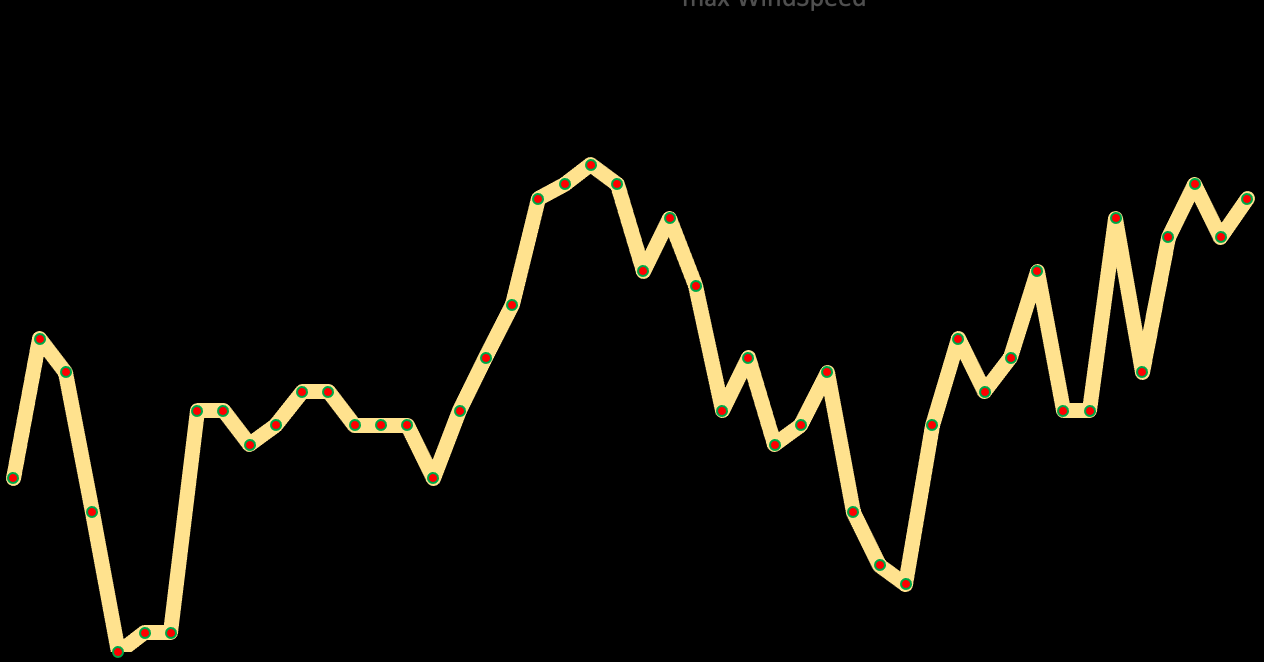
some of the line graphs rendered from the spreadsheet data - green equals left channel , red rich, yellow in the middle of the stereo field, pitch low at bottom of picture high at top of picture. Each sonogram is played as sound score from left to right according the time duration, pitch scale and instrumentation chosen.- see next image for example of use in Metasynth application.
